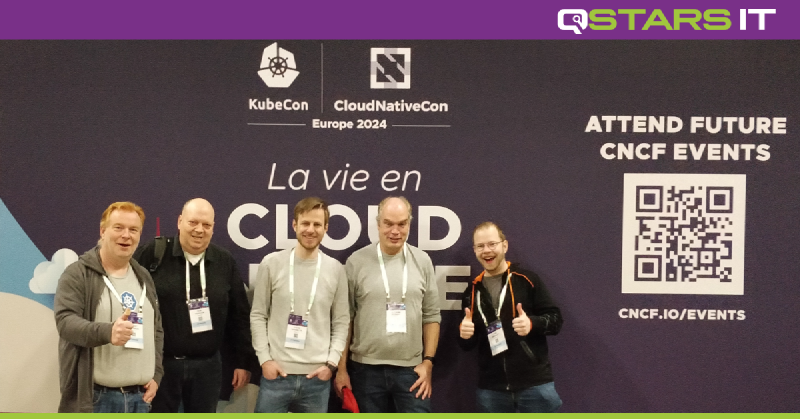
Another KubeCon / CloudNativeCon Europe 2024, this time in Paris. And of course Qstars attended this great conference! We joined with five people to experience the latest developments on the cloud native landscape.
AI, AI, AI
In the first two minutes it became clear that Artificial Intelligence (AI) is the absolute main topic for this conference. AI is everywhere nowadays, and we (as platform engineers) have to deal with that. How can we prepare our infrastructure to handle these AI workloads? What are the best practices in terms of security, performance and scalability?
No surprise GPU producent NVIDIA is one of the main sponsors of this conference. They provide the hardware and drives that are needed for running AI models. GPU’s are getting more optimized for AI workloads. One of the changes is that you can now share a GPU to run multiple workloads in parallel, making it possible to share it over multiple pods of your Kubernetes cluster. Lots of effort has been put into resource management, including NVIDIA DRA (Dynamic Reource Allocation) and DRA functions within Kubernetes.
Running AI models has become easier thanks to some intesting tools. One of them is Ollama, a simple docker-look-a-like tool to download and run models on a local machine (with a GPU). Be sure to give it a try on your own laptop, combining it with the Continue plugin on Visual Studio Code you get a local Copilot experience without sending code out to a remote party; all the magic happens on your own laptop!
Forget the operating system, Kubernetes is your new base
Kubernetes is becoming the new base layer for your compute. Yes, there will be some linux down there, but that’s merely firmware nowadays. Kubernetes not only runs containers, but also WASM stacks, virtual machines and even serverless, so all your favourite cloud compute options are now available on one single platform, even on-prem. Let’s take a quick look on a few of these.
KubeVirt is already out there for a while and has even been adopted into Red Hat OpenShift. With KubeVirt you can run virtual machines on your Kubernetes cluster, for those workloads that you can’t or don’t want to containerize yet. It uses libvirt to run the virtual machines on your cluster nodes.
Web Assembly or (WASM) is a rather new technology that allows you to create very small stacks of code. It was originally created to run code in web browsers (client side), however it appears to be very powerfull for server side applications as well. One of the great features of a Web Assembly stack is the boot time, typically less then a millisecond. This is great for hosting serverless applications. One of the emerging tools for this is SpinKube.
KEDA (Kubernetes Event-Driven Autoscaling) is another way to run your apps in a serverless way. Based on triggers, KEDA can scale the number of pods up or down based on the load. It also comes with a whole bunch of built-in scalers for databases, messaging, pipelines, etc. This makes your landscape very flexible and cost effective.
Karpenter is a great tool to automatically scale your whole Kubernetes cluster. Depending on the requested load it scales your workers nodes up and down, again providing a flexible and cost efficient way of running your workloads.
Observability
So, observability is everything related to collecting, filtering, storing and visualising metrics, logs and traces. The more you automate, the more you need to keep an eye on, so observability is hotter than ever before.
To retreive all metrics from the bottom of your applications, eBPF is the way to go. The kernel provides a set of hooks for tracing and instrumentation. You can dynamically insert some code into the kernel to call these hooks and report back the results to a pod that runs a collector. This collector forwards all metrics to your favourite monitoring stack. A nice tool to explore the possibilities of eBPF is Bumblebee, as demonstrated at one of the workshops during the conference.
Maybe the best way to collect, filter and forward all monitoring data is OpenTelemetry. There are different ways to collect, including running a collector side-car with your app or use the eBPF-collector to collect directly from the kernel.
Prometheus is still a proven tool to store all your metrics in time. Meanwhile much effort has been put into the integration between Prometheus and OpenTelemetry. Combined with tools like Grafana you can build state-of-the-art dashboards for your applications and infrastructure.
Summary
The cloud native community is 10 years old now and still growing rapidly. It has become a great ecosystem which can truly help organisations to run their applications faster, more secure and cost effective. Whenever you need to select a new tool for a solution, always explore the CNCF landscape first!
